Sensitivity analysis is one of the more sophisticated approaches that we employ here at MountainView Risk & Analytics, but we’ve found it to be a powerful way to better understand and interpret model behaviors and their impact downstream. Since it is a more complicated part of model risk management the question must be posed: What does sensitivity analysis offer than other forms of model testing don’t?
In this article, we’ll discuss how sensitivity analysis augments other outcomes testing, how it can be performed, and as well as provide some simple examples of its use.
What Outcomes Analysis is Generally Done
When assessing the performance of a model, model owners can call on a set of performance monitoring tools to determine if a model is working appropriately. Common strategies include back-testing, scenario analysis, or benchmarking the model against alternatives.
These methods are useful to gain a high-level understanding of how the model is performing, but they provide only broad insight into the behavior of the model and how a change in the inputs will impact the model outputs, or calculations that lie downstream from the model. This is more than a secondary concern – in the model risk management, understanding why a model generates a result is as important as what the result is. It’s also necessary to examine:
- Whether the result is consistent with business judgement.
- Where a model is most sensitive to changes in variables.
- How a change in the input variables or the model results will impact downstream processes.
This analysis is often made more vital in 3rd party models because vendors will often only provide high level documentation leaving the internal model mechanics unexplained. To fill these gaps, model owners can perform sensitivity analysis using the model in-house without requiring additional explanation from the vendors that the model was purchased from.
What sensitivity analysis adds to model owner/validators
Incorporating sensitivity analysis as part of ongoing monitoring plans offers banks two main benefits:
1. It enhances model interpretability
A key issue that many financial institutions face is obtaining a complete understanding of the way that 3rd party models work. While vendors generally provide broad details on the model’s specification as well as some general outcomes analysis, gaining insight into the behavior of the model is more difficult as the exact specification of the model is rarely available. While this may not be an issue with a methodology like linear regression, more complex approaches such as transition-based frameworks or ensemble models are often used which require more oversight.
In this context, sensitivity analysis becomes a very powerful tool for understanding the behavior of the model past simple accuracy assessments. A model owner or validator may perform any of the following as part of the sensitivity analysis of a model:
- Test the reaction of the model in response to an economic shock.
- Vary model variables independently to see the impact each has.
- Attempt to find scenarios where the model generates counterintuitive results.
Assessing and documenting this work can either identify shortcomings in model behavior which can be documented and compensated for by the model owner.
Consider the following example:
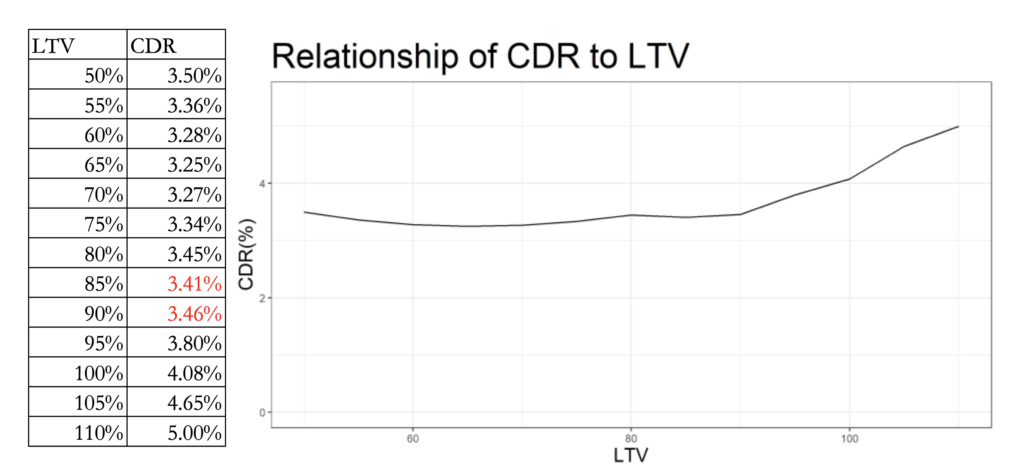
Bank A is testing a model for projecting CDR rates for their mortgage portfolio. In general, it’s accuracy has been as-expected, but the model owner wishes to examine it through a sensitivity analysis. One of the key variables is the LTV ratio, so the model owner utilizes a portfolio of synthetic mortgages where all qualities for the mortgages are identical except for the LTV ratio which is varied by 5% intervals between 50% and 110%.
It generates the results below:

The results show that the model behaves as expected between LTV 50% and 80%, but between 80% and 85% the CDR drops. This finding can be documented by the model owner its relevance to the portfolio noted, and the model owner can now communicate it to the vendor requesting more information on the inconsistency
2. It helps justifies confidence in model results
George Box famously wrote: “All models are wrong, but some models are useful.” A key concern for ongoing monitoring is showing the ongoing usefulness of a model by demonstrating its shortcomings aren’t having an unacceptable impact.
Sensitivity analysis can play a major role showing this by precisely identifying the impact that model inaccuracy has and how it will impact processes downstream. This analysis requires that the model owner coordinate with downstream models and processes to provide scenarios for their results which can then be tested downstream.
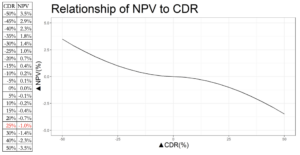
Consider a simple example where Bank A has a model that uses estimates of CDR to predict collateral valuation of its portfolio. Bank A may take the CDR projections that are currently used by the bank and use a set of upward and downward percentage shocks to see how the shifts impact the overall value relative to the current CDR scenario.
A numerical example is provided below. The chart and table show how different percentage changes in the CDR value impact the NPV value:

From the results, we can see that (holding everything else the same) to get a 1% drop in the portfolio NPV there would need to be a 25% increase in CDR from what is currently observed in the scenario. This result, in turn, could be used to inform the boundary for what the model owner considers to be acceptable for the model’s performance.
Summary
The mathematical models used for the wide range of activities in banking often rely on sophisticated approaches that require more than one tool to appropriately understand. Accuracy assessment is the first choice for this task, but it can fall short in allowing banks to truly determine how a model will impact their portfolio. Sensitivity analysis provides a secondary strategy for banks to understand models that would otherwise be a “black-box” and can quantify risk due to changes in the economic environment, or the portfolio.
To learn more about how our team conducts sensitivity analysis and why it should be a consideration in your mathematical modeling contact our team today or send us an email at connect@mountainviewra.com.
Written by Peter Caya, CAMS
 About the Author
Peter advises financial institutions on the statistical and machine learning models they use to estimate loan losses, or systems used to identify fraud and money laundering. In this role, Peter utilizes his mathematical knowledge, model risk management experience to inform business line users of the risks and strengths of the processes they have in place.


