Commentary provided by Dr. Richard Sheehan, Economist
Each quarter I try to present a perspective on where the economy stands and where it is most likely heading, with an emphasis on the implications for bank deposits. This quarter, with the Fed’s recent rate cut, we have more clarity about where we stand. In contrast, recent announcements on tariffs and fiscal policy changes create substantial additional uncertainty about where we are heading.
Starting with GDP, Chart 1 presents actual versus potential GDP. GDP growth has been relatively strong, with a growth rate of 2.9 percent over the past two years, somewhat greater than our long-term growth rate. While that is a strong positive indicator, there are two potential issues, albeit moving us in different directions. While GDP growth has been strong, the unemployment rate has edged up slightly to 4.1%. Arguably, that is more likely sustainable than the recent low of 3.4%. But other macroeconomic indicators also raise some concerns about a potential slowdown with retail sales uponly 2.6% versus its longer-term average of 4.8% and industrial production roughly the same as it was in 2007, although business investment has increased substantially over the past two years. In sum, GDP may present a somewhat more optimistic view of the economy in general than we see in a variety of other economic indicators.
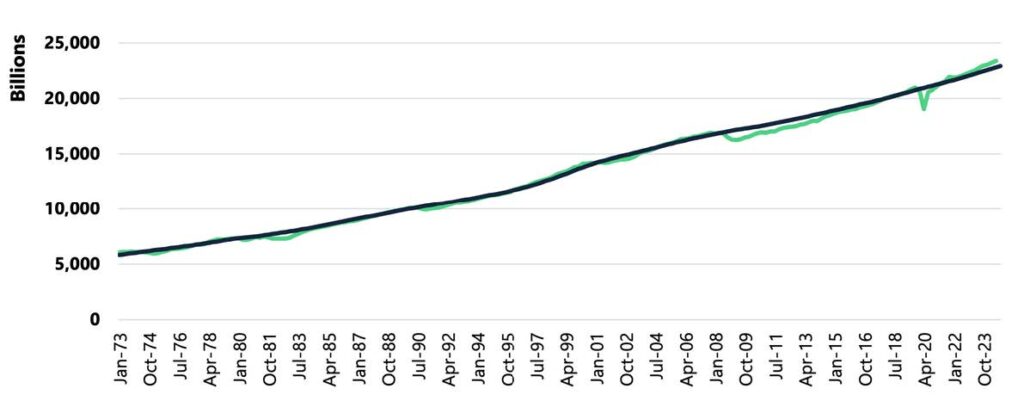
If we return to Chart 1, however, there is one recent item that stands out: recent GDP has been above potential GDP with that gap growing. There are two ways to interpret that result. The first is that GDP growth has been relatively high compared to its potential, a result consistent with the actual GDP numbers but inconsistent with other macro indicators. The alternative interpretation is that potential GDP growth has been slightly understated since the Great Depression.
(Note that the potential GDP’s slope is slightly lower starting in 2008.) I think that the second view is more appropriate and is more consistent with the totality of the data. However, if the assumptions underlying the calculation of potential GDP are correct, then we have a major concern. That is, a positive gap between potential and actual GDP suggests an economy facing excess demand. The implication? We may have an early signal of additional future inflation. That actual GDP was well below potential from 2007 through 2019 led to downward pressure on prices and low interest rates. A trend in actual above potential would likely lead to a contrasting result of increasing pressure on prices and thus inflation which in turn would likely be accompanied by contractionary monetary policy.
Turning to inflation directly, Chart 2 presents core inflation measured by both the CPI and the PCE, with the latter beingthe Fed’s preferred indicator. I have deliberately extended the data in Charts 1 and 2 back to 1973 to give you a view ofwhat likely most concerns the Federal Reserve in its very conservative application of monetary policy. The first spike ininflation in 1974 reflected the first major OPEC oil price increases which the Fed initially tried to offset with an increase in the money supply before quickly reversing course, reducing the money supply and sending the economy into a recession. The Fed relatively quickly declared victory in 1975 and reversed course, and almost as quickly inflation resumed its upward trajectory. That led the Fed to adopt an even more aggressively contractionary policy resulting in the shortest expansionary period in U.S. history and a more prolonged recession than the economy had just been through. (The double dip recession can be seen in Chart 1 from the late ’70s into the early ‘80’s.)
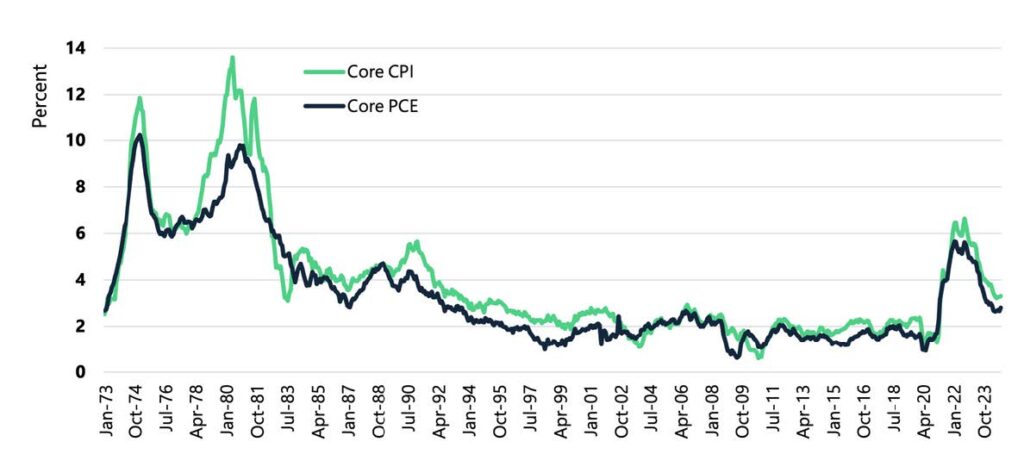
Since that period, Chart 2 shows that the Fed has been much more aggressive in ensuring that we did not have another episode of inflation.
There has been much recent discussion about why we have seen “Biden’s inflation.” I have previously explained at length
that the initial surge was largely due to supply-side factors that impacted not just the U.S. economy but nearly every economy in the world. In the U.S. monetary policy turned very expansionary with the concern that we avoid a complete meltdown, and fiscal policy was likewise expansionary with Trump’s $2.2 trillion CARES Act followed by Biden’s $1.9 trillion American Rescue Plan. Both U.S. monetary and fiscal policy contributed to inflation but in a relatively minor way – and do not explain why inflation was such a worldwide phenomenon.Ultimately the Fed pursued contractionary policy driving interest rates up to a level that we had not seen since the 1980’s and our prior experience with high inflation.
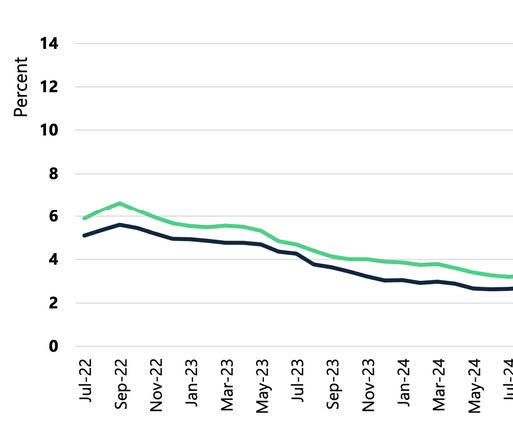
Moving forward, there are two major sources of concern with respect to inflation.One is suggested by the insert to Chart 2
which looks closely at the recent trends in core inflation. From its peak, the rate of price increases has been cut exactly in
half. But progress since May has been non-existent and we remain above the Fed’s target rate of 2%. In turn, that leaves the Fed wondering whether we will have a replay of the double price acceleration seen at the left in Chart 2.
The other major concern is the far right of Chart 1 with actual GDP exceeding potential GDP and suggesting we could
have a double dip of inflation with the first caused by supply shocks and the second caused by a much more traditional
shock, excess demand. In that case, the Fed would likely undertake a much more aggressively contractionary policy than
it has recently, arguably to send the economy into a recession and bring inflation to heel for the foreseeable future as was
done in the early 1980s.
Let me be clear that I am not predicting a recession. What I am saying is that the most likely scenario is continued modest
growth, but even without any additional major shocks there remains more potential inflationary pressure than I thought
was likely even six or nine months ago. That inflationary pressure, in turn, could easily lead to a more contractionary policy
where the Fed would be more concerned with eliminating inflation than with a soft landing. The probability of this
scenario appears relatively low, perhaps 10-20%, but the risk is clear.
Last quarter I spent some time reviewing trade and government deficits. This quarter I want to provide a bit more detail. Recent Trump comments suggest a 25% tariff on Mexico and Canada, a 60% tariff on China, and a 10% tariff on everyone else. This proposal comes after the prior Trump administration negotiated USMCA to replace NAFTA and impacts our three largest trade partners. Among the items most likely to be impacted are produce, automobiles, gas in midwestern states, and computer chips.If the incoming administration’s comments are an effort to push other countries to “play by the rules,” then there may be a positive impact. Economists generally strongly support free trade, but that support is predicated on the assumption of fair trade. That is a country that subsidizes an industry or uses slave labor, for example, would be violating the precepts of fairtrade and should not lay claim to the free trade mantle. There have been serious issues with China’s trade-related policies ever since it was allowed to become amember of the WTO (World Trade Organization).
I think most economists who are familiar with the WTO’s rules would agree that a huge tariff on China is not the appropriate way to deal with the problem. However, if the comments are serious efforts to raise U.S. government revenues to offset tax cuts or fund programs like a childcare credit, they would belie U.S. commitments to free trade and pose a potentially major economic shock.
The most important trade bill passed by the U.S. was Smoot-Hawley in 1930. It imposed a 25% tariff across the board. The
bill successfully reduced imports to 35% of their prior value. Unfortunately, almost immediately all our trading partners
imposed similar tariffs on our goods reducing our exports to 35% of their prior value. If the U.S. were to enact a similar
policy today, it is unreasonable to assume that our trading partners will not retaliate. The net result would likely be similar to the Smoot-Hawley reactions, with a substantial worldwide recession that could also endanger the use of the dollar as
the reserve currency. In addition, tariffs will likely generate substantial additional inflation worldwide. Tariffs are effectively
a tax. U.S. Customs receives the funds paid by the importer and generally passed on to the final user. Many studies of the
incidence of a tariff/tax indicate that over 80% of the tax is paid by the final user with the importer and the original
producer pay only small amounts. The burden of that tax will largely be on U.S. consumers and not on foreign countries.
That tax incidence, with consumers paying the bulk, is yet another potentially serious cause of additional inflation, again
likely suggesting Fed intervention with contractionary monetary policy.
Last quarter I also expressed concern about the state of the budget, and this quarter I want to present additional details.
First, let me emphasize that I am not a “deficit hawk.”Like most economists, I do not believe that the U.S. government can or should consistently run a balanced budget. If we used that rule, we simply would not have won WWII. The more
appropriate rule to be fiscally prudent is to have the ratio of U.S. government debt to U.S. GDP rate remain constant or
decline over time. Much like a business, there should not be a prohibition on borrowing but there should be prudent limit,
e.g. based on the ratio of debt to GDP. From a prudent fiscal policy perspective, we should recognize that during
recessions tax revenues will automatically decline while assistance programs will require greater funds. The net impact
should be a short-term increase in the ratio that will need to be offset by a decrease in the ratio when the economy is
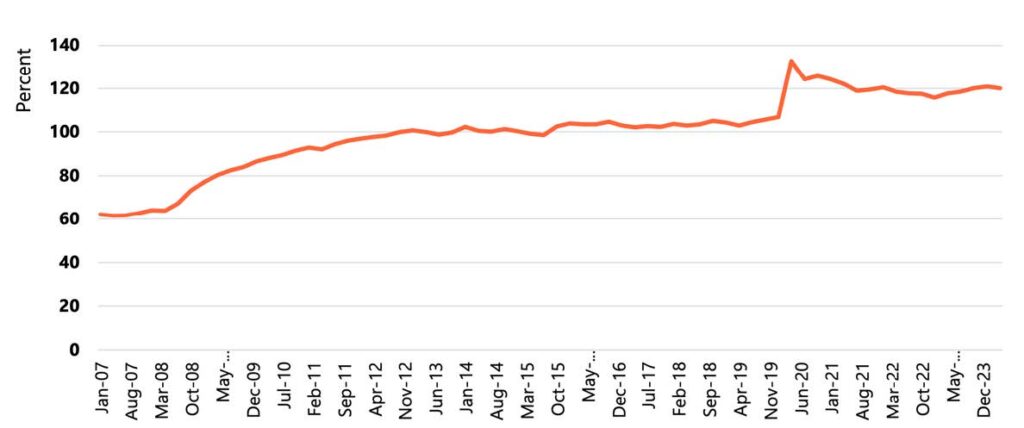
expanding. Chart 3 presents the ratio since just prior to the Great Recession.We observe two periods of high growth,
during and just after the Great Recession and during Covid. Those are not the problem. They reflect the government’s
response to macroeconomic shocks.The real problem is the periods between the two and again after Covid. The ratio
continues to increase even with strong economic growth when prudence indicates the ratio should be decreasing.
From a practical perspective, what does this imply? As I noted last quarter, given a real GDP growth rate of about 2.5%
and a 2% rate of price increase, i.e. the Fed’s target inflation rate, on average we should expect nominal GDP to grow by 4.5% and our debt can grow by 4.5% on average to maintain the desired ratio. Fourth quarter nominal GDP was $29.4 trillion and total public debt was $34.8 trillion. 4.5% of $34.8 trillion suggests a $1.57 trillion deficit, still a huge but maintaining a constant debt-GDP ratio. But keep in mind the goal of having something less than 4.5% growth during good years. If we shave that to 4% for the calculation, then we should have a deficit of no more than $1.39 trillion. The problem? This year’s budget deficit is $1.83 trillion with an estimate of next year’s budget deficit of about $1.9 trillion. The difference between the projected deficit and the deficit required to not continue the spiraling debt load requires a minimum budget reduction of $330 billion. A more fiscally sound cut given that the 2025 forecast is for moderate economic growth would be over $500 billion.
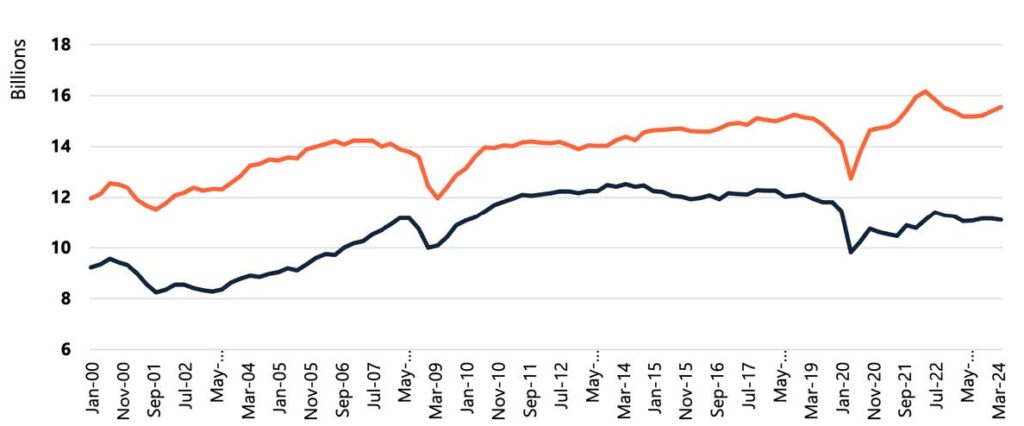
How does that fit with fiscal reality? The simple answer: not well. We can divide government expenditures into mandatory spending and discretionary spending. Mandatory items have already been approved and do not need further authorization. In the 2024 $6.75 trillion budget, total mandatory spending is about $5.12 trillion leaving $1.63 trillion as discretionary. The largest mandatory categories are Social Security at $1.45 trillion, Medicare at $0.87 trillion, Medicaid at $0.62 trillion, and net interest on the debt at $0.95 trillion. The largest discretionary categories are National Defense at $0.85 trillion and Veterans Benefits at $0.14 trillion. Chart 4 presents the shares of government expenditures for the major categories.If we remove mandatory spending plus defense and veterans’ benefits from any cuts, that leaves only 12% or $809 billion eligible for reductions. Only the lightly shaded wedge does not face huge obstacles to reducing expenditures, and that wedge includes everything from international affairs to the administration of justice to national parks.
Politicians can make claims of plans to reduce expenditures by $2 trillion or use tariffs to generate hundreds of billions of dollars in additional revenues. That talk is cheap, but the numbers and the math are inexorable. There is no easy solution and there is no quick solution to this budgetary impasse. The good news? In the long term, this is a fixable problem in a growing economy.
Turning to monetary policy, I have already noted that the Fed has signaled that it is considering further rate cuts, although they may be delayed based on evolving macro data. Given the lack of recent progress in reducing inflation to the Fed’s target and the continued moderate overall economic growth, I expect that the Fed will be very conservative with future rate increases. Substantial rate cuts would likely reduce long-term Treasury rates and interest payments on the debt and alleviate part of the government’s budgetary problems, but the Fed’s view of its role is managing the economy and not managing the government budget.
I typically have also emphasized the role of the monetary base in terms of indicating the direction of monetary policy. Recently there has been relatively little change in the MB, and it appears that the Fed is trying to slowly reduce the size of its portfolio that expanded dramatically with quantitative easing. At the moment it does not appear to contribute to the
understanding of monetary policy.
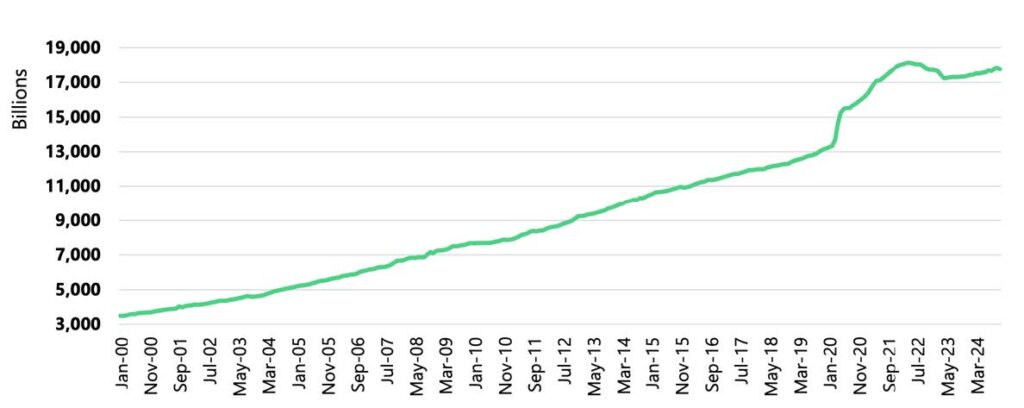
In terms of growth in deposits, Chart 5 presents recent growth, from a few years prior to the pandemic to a few years after. There is a clear increase in deposits and deposit growth early in the pandemic. What is more relevant for a perspective on
future deposit growth, however, is the difference between the pre- and post-pandemic trends. From the period between the Financial Crisis and Covid, deposit growth was a relatively steady 2.9%. Since Covid it has also been relatively steady but only averaged 1.0%.Based on the data and the relative lack of movement even with substantial changes in interest rates, it appears to be a good bet that deposit growth remains about 1.0 percent for at least the next couple of years, barring another substantial shock to the economy.
What could cause such a shock? A resurgence of inflation, higher tariffs, a full-out trade war, an escalation of tensions either in the mid-East or Ukraine or even a conflict over Taiwan. All appear at the moment to be low probability events. General fiscal policy uncertainty with a change in administrations or a further deterioration of the commercial real estate market, I think, has a somewhat higher probability of causing a slowdown. The most likely, however, appears to be a dramatic uptick in deportations. Deportations need not be highly problematic. The Obama administration deported about 400,000 in 2012 and averaged about 340,000 over eight years while the Trump administration averaged about 200,000. If the incoming administration pursues a policy of removing criminals and those who have recently arrived as economic refugees, there would be little economic disruption. In contrast, if the goal is to remove over 10 million individuals, many of whom have been here for a long time and are productive members of their communities, then we would be talking about severe economic disruption, in particular in construction and agriculture, with the potential to see both a recession and inflation simultaneously.
To avoid ending on such a negative note, let me emphasize that I remain cautiously optimistic about the economy. Economic growth is most likely to remain in the 2-3% range. Unemployment is unlikely to rise appreciably. There are yellow flags associated with a potential resurgence of inflation, but the Fed appears to be motivated to focus on not allowing any major resurgence. Deposit growth appears likely to remain steady but low by historical standards.There are multiple storm clouds on the horizon given the shocks listed above, but, with a bit of luck and reasonable economic stewardship, we should be able to maintain our current economic trajectory for at least the next year.
About MountainView Risk & Analytics
For over two decades, MountainView Risk & Analytics, A SitusAMC company, has helped clients accurately forecast outcomes and make balance-sheet decisions through an integrated methodology and advanced statistical modeling that incorporates a multi-layered, institution-specific analysis. We assist clients in developing credit risk, model risk and enterprise risk strategies and infrastructures to achieve optimal profits, as well as assessing and quantifying the various risks embedded within the organization. Our team collaborates with clients and provides insights and best practices from engagements across the country, bringing this knowledge to bear on every assignment to assist clients in their business needs. If you would like to learn more about working with MVRA please submit a request to connect today!


