
Commentary provided by Dr. Richard Sheehan, Economist
Historically, my primary focus has been on monetary policy and its implications for inflation, interest rates, and deposits. This quarter we will start by considering two topics potentially having major long-term impacts even though their short-term impacts likely will be limited. Both issues have featured prominently in election-related news. They are (1) imports, the balance of payments and tariffs, and (2) the federal government deficit and implicitly taxes and government expenditures. Both are highly charged politically, and neither has been well handled by the press.
First, Chart 1 presents U.S. imports and exports as a percent of GDP for the 21st century. Two points are clear. First, both imports and exports have been growing over the entire period. This growth largely reflects the growing internationalization of both U.S. trade and world trade. Countries increasingly specialize in areas where they are most efficient and have comparative advantages. Other things equal, specialization increases efficiency, helps keep prices and inflation down, and should improve standards of living across the globe. The Law of Comparative Advantage is one of the key tenets of the economics of international trade.
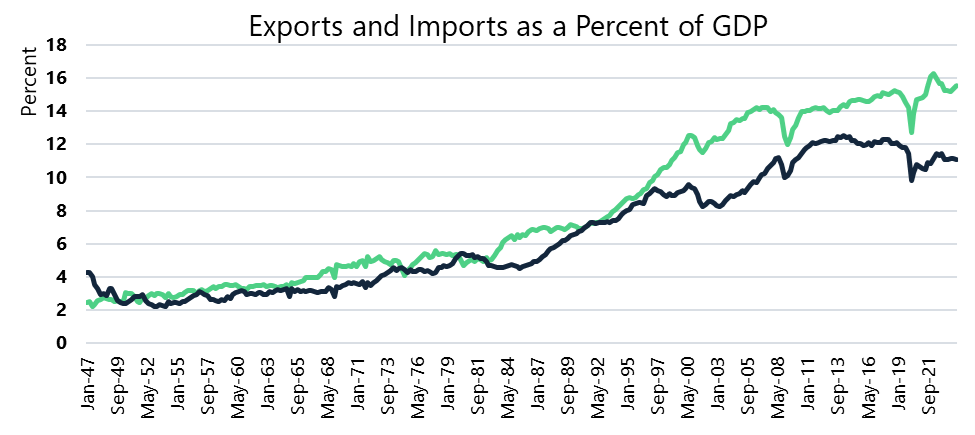
Chart 1 indicates that the U.S. has run a trade deficit continuously in this century. In the 74 years since 1950, in only 18 quarters have exports exceeded imports, and only once has that surplus been over 0.5%. Frequently trade deficits have been treated as a problem and an indicator of the weakness of the U.S. economy. That is, we are incapable of producing everything that we want to consume.
While this perspective is understandable, it is also likely mistaken. It ignores one basic economic fact: trade is a two-way street. For example, we want to buy cell phones, and the best/cheapest are produced outside the U.S. The sellers of those phones are willing to sell them and receive dollars in return. Both demand and supply must be present for a transaction, begging the obvious question why is there a worldwide demand for dollars?
There are two components to the answer. First, international trade has grown dramatically since World War II, and the U.S. dollar is the reserve currency. That is, most international transactions are denominated in dollars. Growth in world trade means growth in the demand for dollars to facilitate that trade. The growth in the demand for dollars in turn potentially drives our growing trade deficit. And second, the U.S. dollar and the U.S. economy are viewed as a safe haven to most of the rest of the world. In turn, that drives demand for dollar-denominated assets. Japan, for example, holds over $1 trillion in U.S. Treasury bonds while China and the United Kingdom hold over $700 billion. Viewed from this perspective, the U.S. trade deficit represents a sign of strength of the economy rather than a sign of weakness because the rest of the world wants to hold a portfolio that is heavy with dollar-denominated assets.
Whether we view the trade deficit as a weakness or a strength, the most important thing to note is that the U.S. is in a unique position because the dollar is the reserve currency. That fact makes growth in world trade critical for our ability to continue to run a trade deficit. If world trade declines, we should expect the demand for dollars to fall and the value of the dollar to fall as a result, making imports more expensive and increasing the cost of living.
What is the easiest way to get the dollar to fall? Impose tariffs on imported goods. Make foreign producers pay a penalty to sell in the U.S. A tariff is paid directly by the importer and typically is passed on to consumers in the form of higher prices. Foreign producers may end up receiving slightly lower prices as their demand falls, and importers may not pass through all the costs of a tariff. However, the economic literature strongly indicates that consumers pay most of the tariffs, and higher tariffs lead to higher inflation. More inflation, however, is only the second biggest concern with higher tariffs. The biggest? A serious worldwide recession. I would refer you to the Smoot-Hawley Tariff of 1930. It did not cause the Depression but did turn what should have been a severe but relatively ordinary recession into the Depression. Within a few months of the U.S. enacting Smoot-Hawley, virtually every country in the world imposed similar restrictive tariffs on U.S. exports. World trade quickly plummeted, and standards of living dropped worldwide.
I believe – and certainly hope – that we will not see an increase in U.S. tariffs, but that possibility and the potential for a severe recession should not be ignored and creates additional uncertainty in economic forecasts.
The second major issue I want to address is the government deficit and debt. No one would ever mistake me for a deficit hawk, but Chart 2 presents a view of the government debt that future administrations will need to address. The magnitude of the deficit or debt is a common focus of deficit foes, but those are seriously misleading measures. If a firm requests a loan, one metric employed to determine whether a loan can be prepaid would be the magnitude of debt versus the amount of income. Chart 2 presents government debt as a percentage of GDP, similar to a firm’s debt-to-income comparison. At the macro level, if the debt-to-GDP level is constant or decreasing, then government finances likely are not a major issue. Currently, GDP is approaching $30 trillion. Given that the economy grows on average by about 2.5%, then the U.S. could run a deficit of about $750 billion per year and maintain the current ratio. Unfortunately, the problem is not that simple.
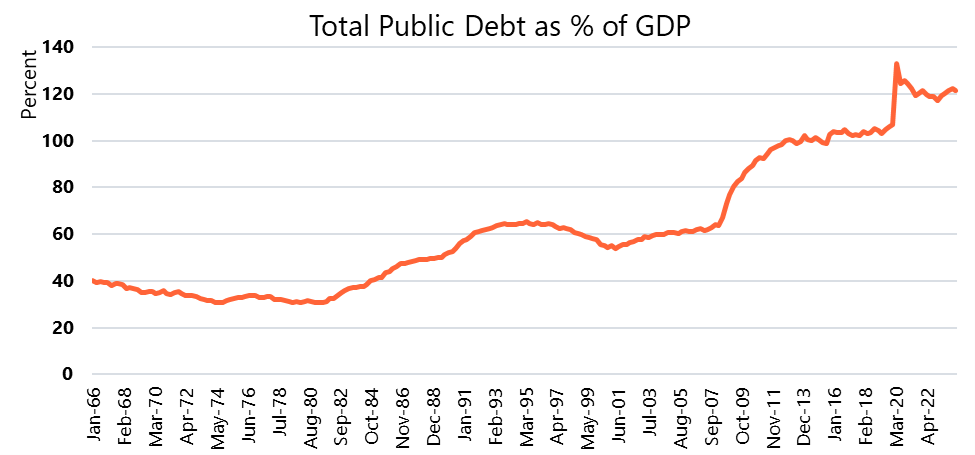
From 1950 to 1980 the debt-to-income ratio fell even as the U.S. ran deficits. The magnitude of the deficits incurred during World War II was being gradually erased because GDP was growing faster than government deficits. Since 1980 the chart indicates the debt-to-income rate has increased, albeit unevenly, with the single exception of during President Clinton’s second term.
We should expect and hope to see some variation in this ratio over the course of the business cycle. Deficits and debt increase during recessions as income and taxes decrease and spending increases. The two largest jumps occurred during the Great Recession and Covid-19. What generally has been missing, however, is a reduction in the ratio once we return to full employment. Running deficits greater than 2.5% during a recession would not be a problem – if we ran deficits smaller than 2.5% during expansions. That has not been the case.
It is not productive to cast blame for this trend since growth in the debt-to-GDP ratio has occurred during both Democratic and Republican administrations. And I am definitely not arguing for a debt ceiling. I am simply noting that future administrations will face economic constraints that previous administrations have not faced based on this trend, and those constraints will introduce yet another element of uncertainty into economic forecasting.
Let me now return to our “regularly scheduled programming” – inflation, monetary policy, interest rates, and the implications for deposits.
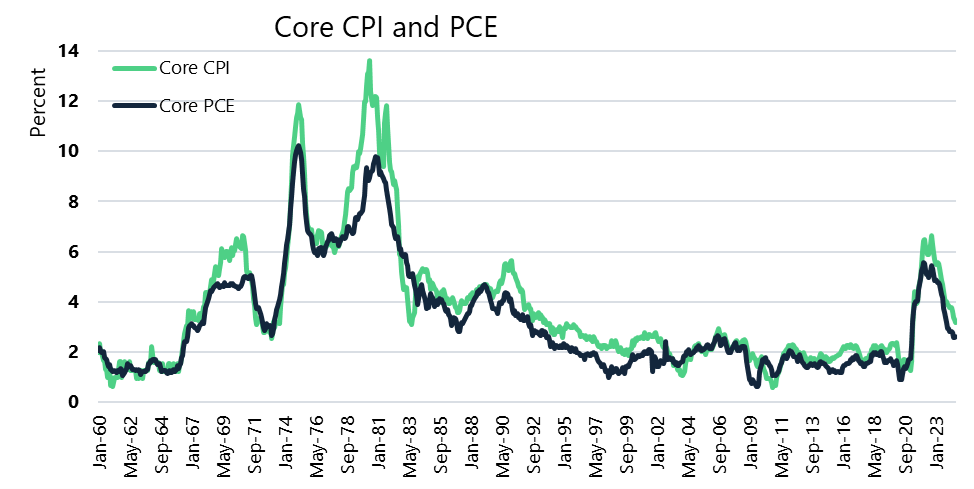
Chart 3 presents two measures of core inflation, one based on the CPI and the other based on the Federal Reserve’s preferred measure, PCE. While they move closely together, the Fed’s measure has been slightly but consistently lower and closer to the Fed’s inflation target. The insert containing only the post-Covid rates, however, shows the problem facing the Fed. Inflation quickly increased after and during Covid with fiscal and monetary policies both expansionary and supply chain issues creating an additional inflationary stimulus. The policy steps taken to address the economic impact of Covid generally were appropriate generating the speediest recovery from a recession and reducing the unemployment rate from 14.8% to 6.8% in only six months. Doing that, however, came with the price of increased inflation, and eliminating inflation is a much slower process. Inflation has steadily decreased since February 2022, but even by the Fed’s PCE measure inflation at 2.6% remains slightly above the Fed’s 2% target. Based on the current slow rate of decline, less than 1% per month, it likely will be another year before the Fed hits its target. FOMC members do not project a 2% inflation rate until 2026, based on both the CPI and the PCE inflation measure.
In terms of Fed policy, I will admit to being disappointed that the Fed did not choose to reduce the federal funds rate at its August meeting. The rate cut of 50 bps at its September meeting was priced into Treasury rates well in advance of its meeting, albeit with a bit of hedging between a 25 and 50 bps drop. The Fed’s goal now: ensuring that we continue the soft landing but without having inflation spike back up. They likely have been and will continue to be very cautious given their history of dealing with inflation. In 1984 they thought they had inflation beat and it came back to bite them when they took their foot off the brake.
I stated earlier this year that while the Fed was predicting three rate cuts, I thought two were more likely given the limited number of FOMC meetings. Either two or three rate cuts this year are still a possibility but the magnitude will also matter. The FOMC’s September Summary projects a funds rate by the end of the year down another 50 bps. Based on that projection, we could see another 50 bps drop at the Committee’s November meeting or two 25 bps rate cuts at their November and December meetings. At this point, I suspect that those two options are equally likely. The FOMC also signaled that further cuts may be coming in 2025, with a projection of another 100 bps drop during the year and even a further 50 bps drop in 2026 returning the federal funds rate to 2.9%. When looking far into the future though, the long-term central tendency of the FOMC ranges from 2.5-3.5. From an equilibrium position, where rates end up is somewhat unclear even to the FOMC, although it appears that all FOMC members believe that the funds rate will be reduced by at least 200 bps over the next few years.
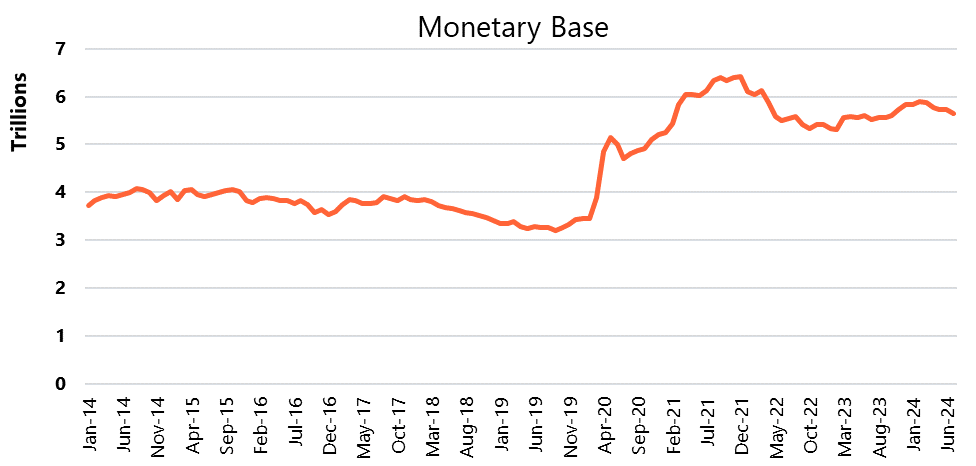
What appears most interesting about the Fed’s recent approach is that it may be putting more emphasis on its rate changes than on changing the monetary base (MB). For a long time, I have emphasized that changes in the MB were a better indicator of what the Fed is actually doing while the funds rate was a better indicator of the signal that the Fed wanted to send. However, with the introduction of the IORB rate moving in step with the funds rate, that decision calculus appears to have changed. In particular, the Fed also has the goal of reducing the magnitude of its portfolio, built up by Quantitative Easing (QE) both after the Great Recession and then even more dramatically in a brief period with Covid. Chart 4 shows that the MB has steadily albeit slowly decreased recently. Normally I would say that such a decline in the MB would indicate a trend toward more contractionary monetary policy. Recent comments by members of the Federal Open Market Committee (FOMC), however, suggest further rate cuts and more expansionary policy may be coming and suggest the drop in the MB is due to another factor, e.g. slowly unwinding QE.
Where does that leave us? Last quarter I presented four factors that would impact the Fed’s decision-making: (1) a desire for inflation to continue declining, (2) no increase in unemployment, (3) maintaining or increasing long-term growth, and (4) a desire to unwind its portfolio (MB) swollen by multiple rounds of QE. The first two generally receive the most focus, and the 50 bps change suggests that the Fed is now more concerned about “sticking” the soft landing and less concerned about re-igniting inflation. As long as inflation continues its slow but steady decline, I would expect the Fed to continue to drop interest rates according to its September Statement. Any spike in inflation, however, is likely to delay further rate cuts. I do not expect that to happen, however, since one of the primary but lingering causes of the slow drop in inflation has been an increase in housing costs. Reducing interest rates should bring housing costs down and paradoxically may reduce inflation at least in the short term. It is important to note that all the Fed projections are based on a soft landing without any inflationary spurts. Keep in mind though that month-to-month changes in the price level tend to have some volatility which is why we generally focus on the yearly percent change. A month or two of spurts could easily delay further rate cuts and likely explain why the Fed has been relatively slow in initiating the process of reducing interest rates.
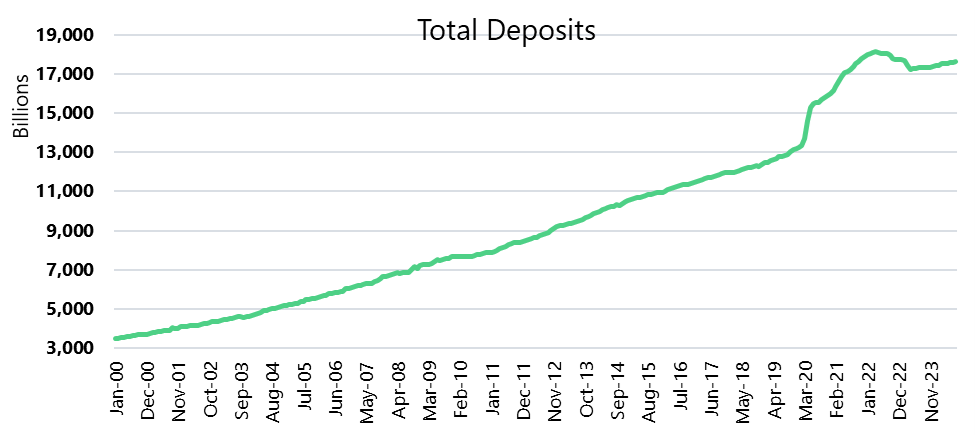
I have typically been predicting modest but steady deposit growth. That remains my prediction. Tariffs and government debt issues could pose major challenges to the economy and deposits. At this point, however, I would consider them factors that increase the potential volatility of deposits moving into 2025 rather than something that would impact the expected level of deposits. The gradual drop in the monetary base is likely the biggest potential reason for a slowdown in deposit growth. While that is possible, the evidence suggests that it is unlikely. Chart 5 presents monthly total deposits in the 21st century. Before the pandemic, annual deposit growth initially averaged about 3.6%. Since the substantial drop in deposits in early 2023, deposit growth has averaged only 0.9%. While it is tempting to argue that a slow unwinding of QE and the resulting drop in the MB would keep deposit growth low, historical evidence suggests otherwise. While the Fed was previously unwinding QE in 2017-18, deposit growth did slow down to 2.2%, but still well above the recent deposit growth rate. Given lower interest rates and a lower opportunity cost of holding deposits as other rates decline, it is reasonable to expect deposit growth to increase, most likely relatively close to the deposit growth rate of 2.2% observed in 2017-18.
About MountainView Risk & Analytics
For over two decades, MountainView Risk & Analytics, A SitusAMC company, has helped clients accurately forecast outcomes and make balance-sheet decisions through an integrated methodology and advanced statistical modeling that incorporates a multi-layered, institution-specific analysis. We assist clients in developing credit risk, model risk and enterprise risk strategies and infrastructures to achieve optimal profits, as well as assessing and quantifying the various risks embedded within the organization. Our team collaborates with clients and provides insights and best practices from engagements across the country, bringing this knowledge to bear on every assignment to assist clients in their business needs. If you would like to learn more about working with MVRA please submit a request to connect today!